Fig. 2.

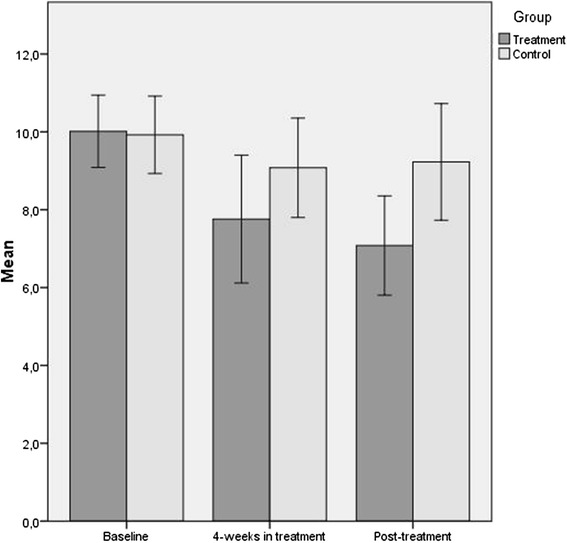
Bar-chart illustrating means for the scoring on GAD-Q-IV, with associated 95 % confidence interval, for treatment and control group at baseline, 4 weeks in treatment, and post-treatment

Bar-chart illustrating means for the scoring on GAD-Q-IV, with associated 95 % confidence interval, for treatment and control group at baseline, 4 weeks in treatment, and post-treatment