
Fig. 2.
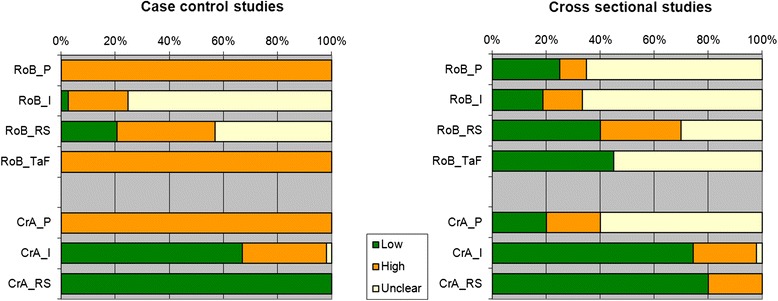
Methodological quality graph. Review authors’ judgements about each methodological quality item presented as percentages across all included studies. On the left-hand side the judgements for the included case control studies; and on the right-hand side those for the included cross-sectional studies. RoB: Risk of Bias; CrA: Concerns regarding applicability; P: patient sampling; I: Index test; RS: Reference Standard; TaF: timing and flow