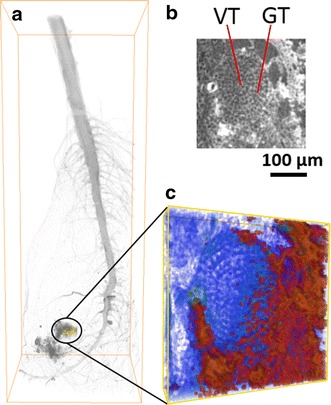
Fig. 4.

The micro-scale of root segmentation localized at yttria NPs aggregated regions. a The selected yellow region in 17.2 keV visualization. b The top transverse slice of yellow frame region. c Magnified view of yellow frame. The vascular tissue (VT) and ground tissue (GT) are shown in (b). The red regions in (c) show the distribution of yttria NPs. The yellow frame size is 0.58 x 0.58 x 0.13 mm
