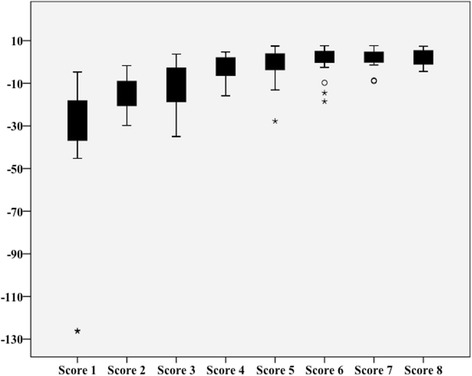
Fig. 4.

Boxplots of the 8 z-scores. In this boxplot the results of the z-scores are depicted. It is seen that there is a relevant development of the z-score throughout the whole training which flattens after the forth exercise. The participants ended with high scores in the seventh and eighth exercise with also relevantly less distribution of the standard error
