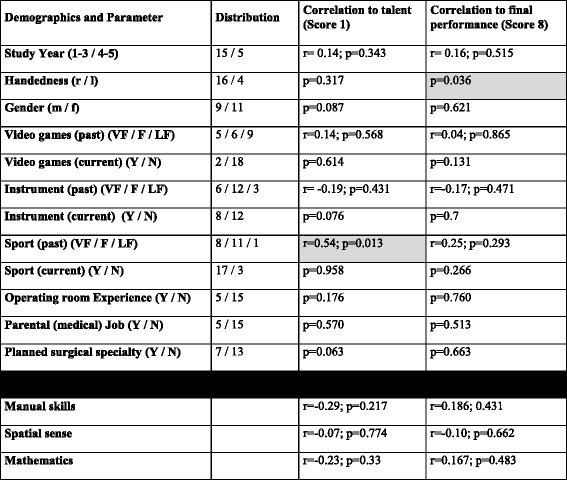
Table 1.
In this table the relevant demographic and information of the questionnaire with the associated correlation to the first (score 1) and the final (score 8) performance is depicted. The statistically significant correlations are gray highlighted and include the positive correlation of playing frequently sport to the first performance (score 1). Secondly, in the final score 8 all the participants were right handed and the left handed participants had a low final score 8 why this was significant

In the binary results the Mann–Whitney-U test was performed and p-value was given. In the other continuous and ordinal variables the Spearman rank correlation test was performed and r- and the p-value depicted
Abbreviations: r right, l left, m male, f female, VF very frequent, F frequent, LF less/not frequent, Y Yes, N No
