Fig. 4.

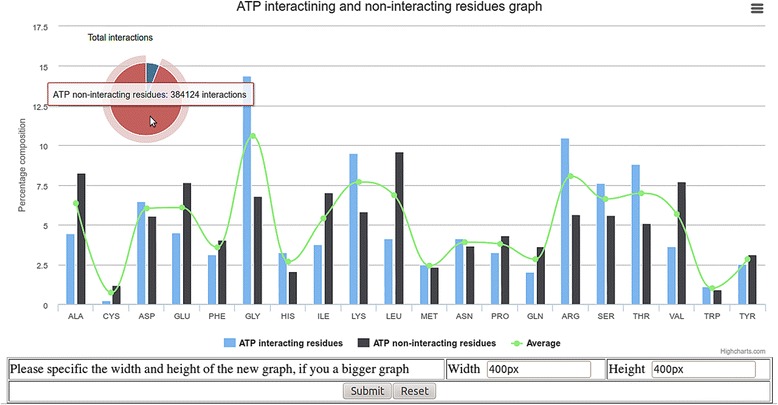
Example output of analysis module of server LPIcom for ATP with composition option; bar graph shows the composition of ATP interacting and non-interacting residues along with the average amino acid composition of proteins

Example output of analysis module of server LPIcom for ATP with composition option; bar graph shows the composition of ATP interacting and non-interacting residues along with the average amino acid composition of proteins