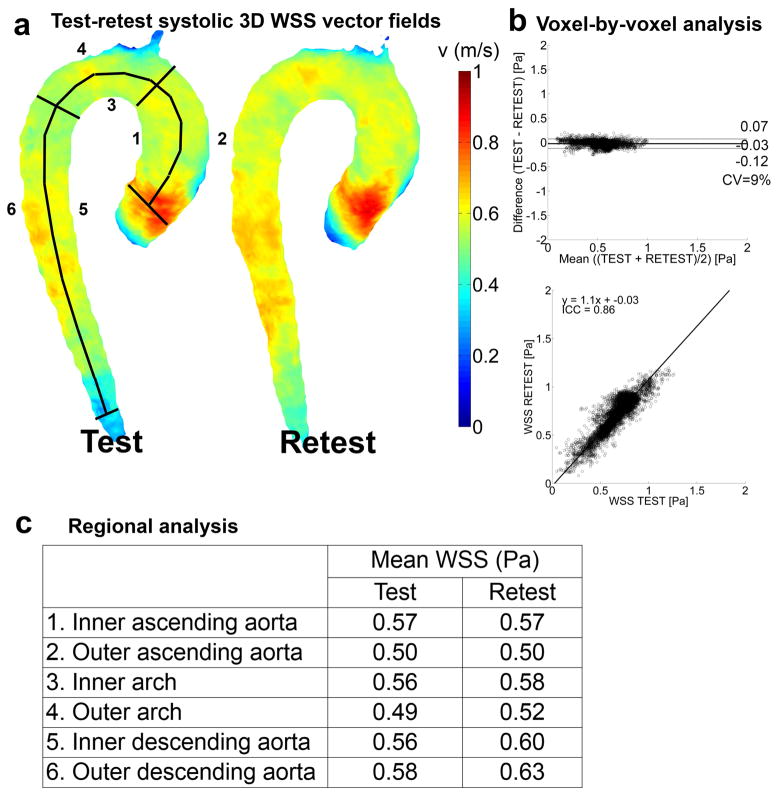
Figure 4.
The results for the test-retest analysis for the cohort-averaged WSS map. a) Full 3D rendering of the WSS magnitude field used for the voxel-by-voxel analysis with the delineation of the regions of interest for the regional analysis. b) Voxel-by-voxel analysis: Bland-Altman plot (top), orthogonal regression (center) and angle distribution (bottom). c) Regional analysis: mean WSS values and variability for test and retest in the six regions displayed in (a).

