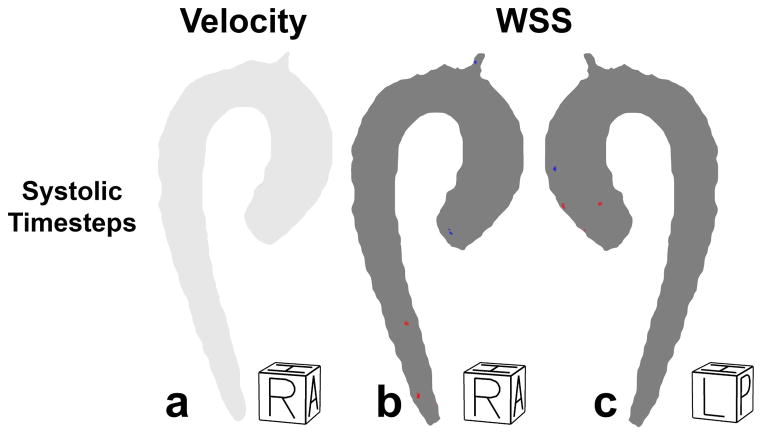
Figure 5.
a) Right-Anterior view of the test-retest P-value maps for velocity at the averaged systolic time frames. The region where retest velocity is significantly higher/lower than test velocity would have been shown in red/blue. However, no significant differences were found. b) Right-Anterior view of the test-retest P-value maps for WSS at the systolic time frames. The region where retest WSS is significantly higher/lower than test WSS is shown in red/blue. c) Left-posterior view of the test-retest P-value maps for WSS at the systolic time frames. Regions without significant differences are shown in grey.

