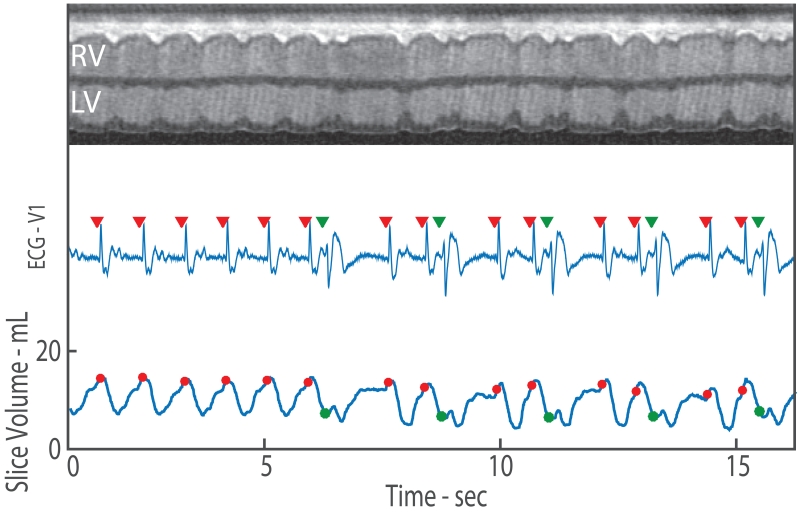
Figure 1.
2D real-time CMR imaging with synchronized ECG recording and measurement of slice volume over time. Top row shows a projection through the heart where the contraction of the left ventricle begins in sinus rhythm and transitions to PVCs. The synchronously recorded ECG is shown in the middle row with the identification of the R-wave demarcated by a red triangle for sinus beats and green triangle for PVC beats. Quantification of slice volume (bottom row) allows for observation of the change in slice function due to arrhythmia. The slice volume associated with the R-wave (beginning of contraction) is shown via dots. For sinus contractions, the red dots occur close to the maximum slice volume (LV EDV). However, during a PVC, the green dots indicate PVC preload which may be substantially lower than the LV EDV.

