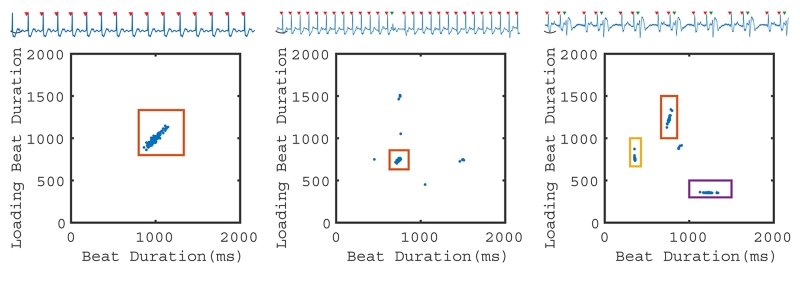
Figure 2.
2D RR-duration plot. Grouping of beat types based on beat duration RRi and loading (previous) beat duration RRi-1. On the left, a patient with sinus rhythm is shown with a single ECG and one 2D cluster. In the middle, a patient with a single PVC (green triangle) demonstrates how the algorithm can be used to provide arrhythmia rejection. When PVCs are infrequent, they were not observed at all slice locations and therefore did not result in global volume measurements. On the right, a patient in trigeminy exhibits four beat clusters. Three clusters (with colored boxes) were observed at all slice locations. The remaining cluster (sinus-sinus) was only observed at a single slice location and is therefore excluded from further analysis.

