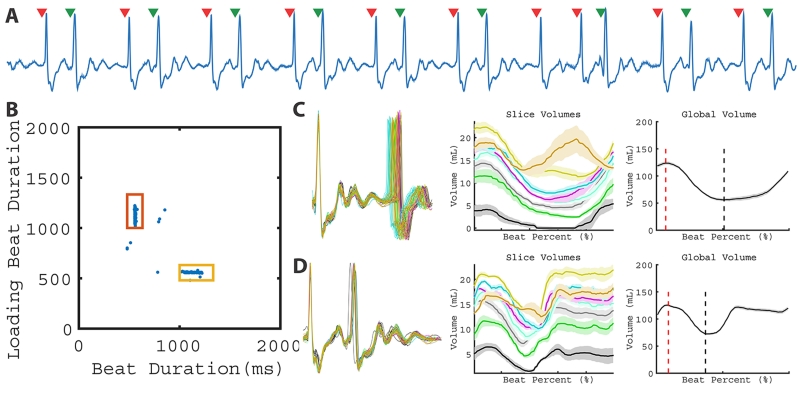
Figure 4.
LV function of a subject with bigeminy. A representative ECG (A) from a single slice demonstrates the bigeminy pattern. Two beat clusters are observed in the 2D plot of RRi-1 vs RRi (B). As a result, two different global patterns can be quantified in C and D. Corresponding global volume measurements are found in Table 1 (Patient 6).

