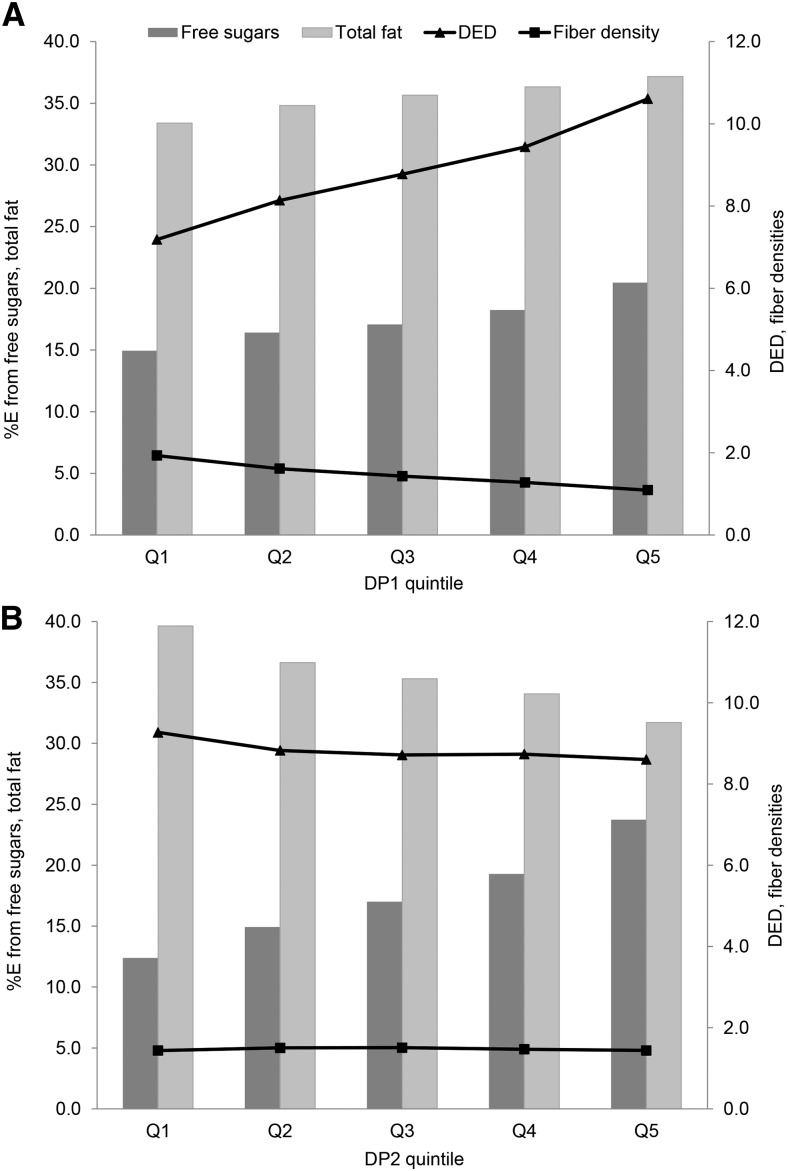
FIGURE 1.
Intakes of response variables by quintile of DP z scores characterized by %E from free sugars, %E from total fat, DED (in MJ · g−1 · d−1), and fiber density (in g · MJ−1 · d−1) at 7 y of age in the ALSPAC cohort for DP1 (A) and DP2 (B). Values are means, n = 1457 in each quintile. ALSPAC, Avon Longitudinal Study of Parents and Children; DED, dietary energy density; DP, dietary pattern; DP1, energy-dense, high %E from free sugars, high %E from total fat, low fiber dietary pattern; DP2, non–energy dense, high %E from free sugars, and low %E from total fat dietary pattern; Q, quintile; %E, proportion of total energy intake.

