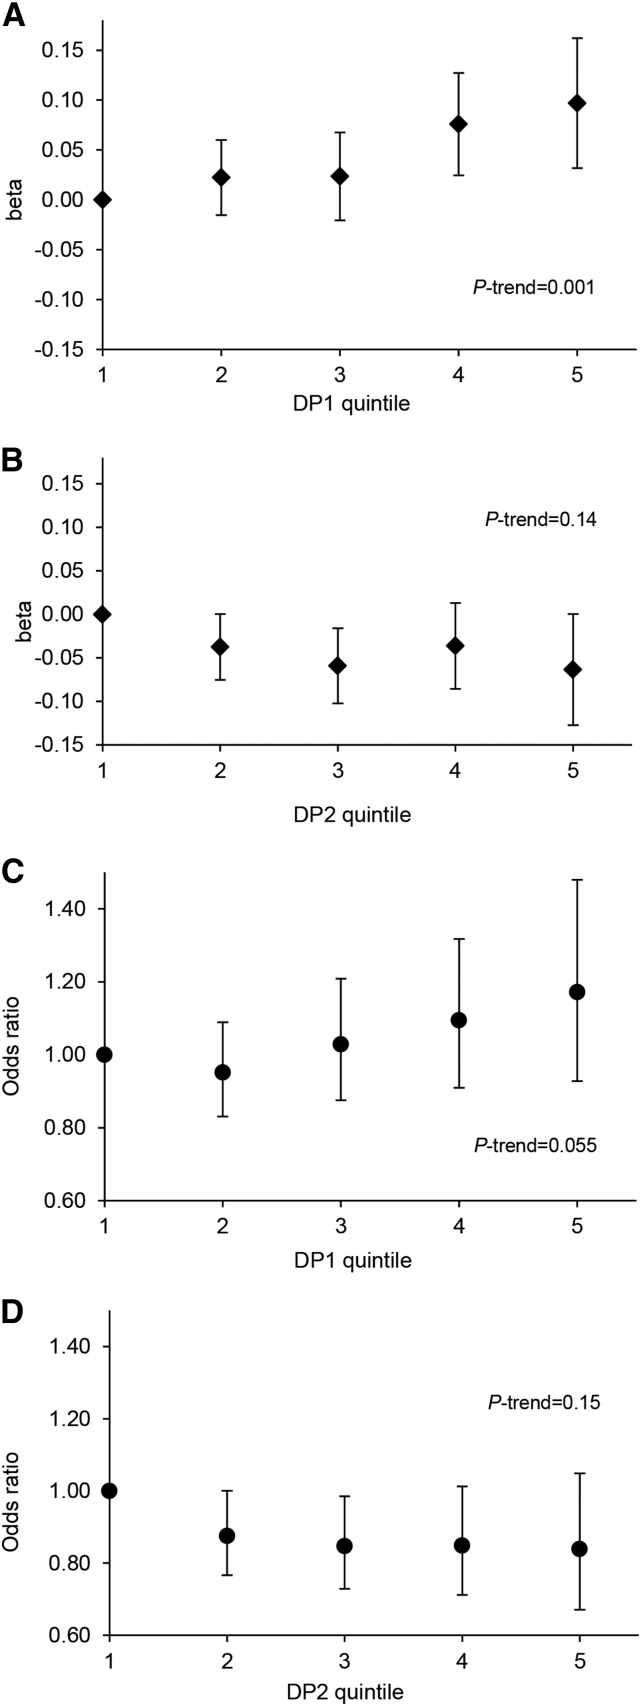
FIGURE 3.
Quintiles of DP1 and DP2 z scores in relation to FMI z score (A, B) and odds of excess adiposity (C, D) between 7 and 15 y of age in the ALSPAC cohort. (A, B) Plotted values (diamonds) represent the mean increase in FMI z score (β-coefficients and 95% CIs) associated with a quintile increase in DP z score between follow-ups, relative to the lowest quintile, adjusted for age, sex, dietary misreporting, physical activity, and maternal social class. (C, D) Plotted values (circles) represent the odds of excess adiposity (ORs and 95% CIs) associated with a quintile increase in DP z score between follow-ups, relative to the lowest quintile, adjusted for age, sex, dietary misreporting, physical activity, and maternal social class. P-trend values were derived from modelling DP quintiles as continuous variables. DP1 median z score in each quintile: −1.37 (Q1), −0.47 (Q2), 0.06 (Q3), 0.56 (Q4), and 1.28 (Q5); DP2 median z scores in each quintile: −1.07 (Q1), −0.47 (Q2), −0.05 (Q3), 0.39 (Q4), and 1.14 (Q5). ALSPAC, Avon Longitudinal Study of Parents and Children; DP, dietary pattern; DP1, energy-dense, high %E from free sugars, high %E from total fat, and low-fiber dietary pattern; DP2, non–energy dense, high %E from free sugars, and low %E from total fat dietary pattern; FMI, fat mass index; Q, quintile; %E, proportion of total energy intake.

