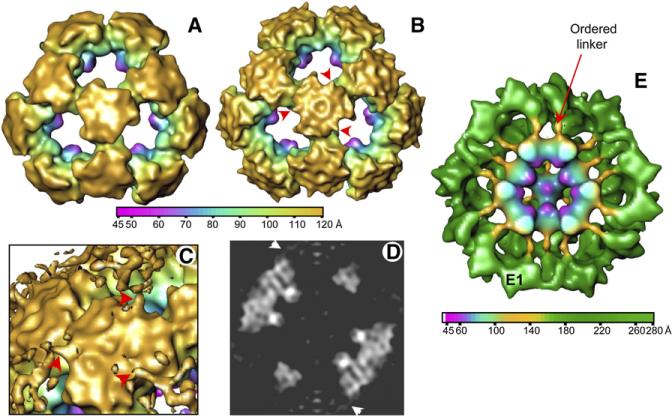
Figure 2. 3D Structures of Human PDC Cores.
(A and B) Outer view of a shaded surface representation of the (A) human tE2 and (B) full-length E2 cores, reconstructed to 15 Å resolution. Maps are color coded according to particle radius. The E2 core contains additional features (arrowheads) that are not present in the tE2 structure.
(C) Close-up view of the region surrounding a trimer shown at a lower-density threshold.
(D) Central slice through the reconstruction in (B), shown as a gray-level display. Arrowheads in (C) and (D) indicate the same features as in (B).
(E) A 25 Å resolution reconstruction of intact PDC isolated from bovine tissues. The linker densities emanate from the E2 core, at the same locations as revealed in the human E2 core structure (see [B]–[D]). The linker extensions are more clearly visible in the bovine PDC structure than in the human E2 core structure because the extensions are likely stabilized by binding of E1 (Zhou et al., 2001a).

