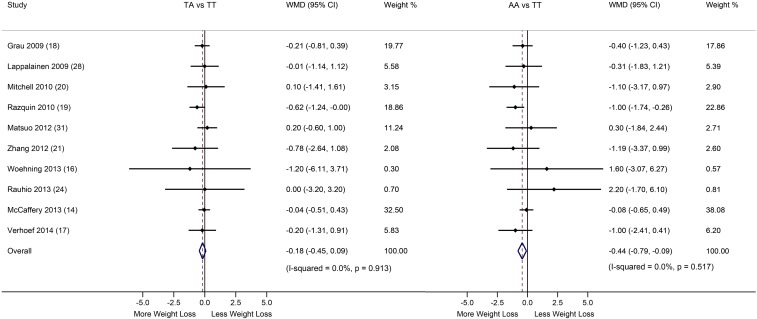
FIGURE 2.
Differences in weight loss in the FTO TA and AA genotype groups compared with the TT genotype group. Data are WMDs and 95% CIs in weight loss between the FTO genotype groups across studies, and pooled results were calculated with the use of fixed-effect models. A Cochran’s Q test and the I2 statistic were used to test the heterogeneity between studies. Horizontal lines denote the 95% CIs; solid diamonds represent the point estimated of each study. The open diamond represents the pooled estimate of the lifestyle intervention effect. The dashed lines indicated the point estimate of the pooled result. FTO, fat mass and obesity–associated; WMD, weighted mean difference.

