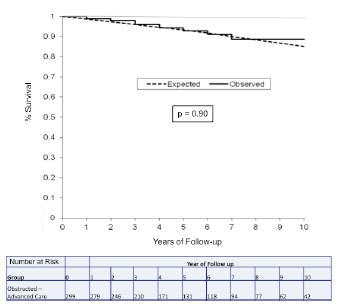
Fig. (14).

Kaplan-Meier plot comparing observed survival in the obstructed advanced-care group (n=299, solid line) versus the expected survival based on 2005 US survival matched for age, sex and race (dashed line). Reproduced by permission Sherrid et al. Circ Heart Fail 2013 same as Fig. (13).
