
Figure 3. Yin-PSCs and Lin-PSCs Have a Naive-like Transcriptional Profile Distinct from that of Primed PSCs.
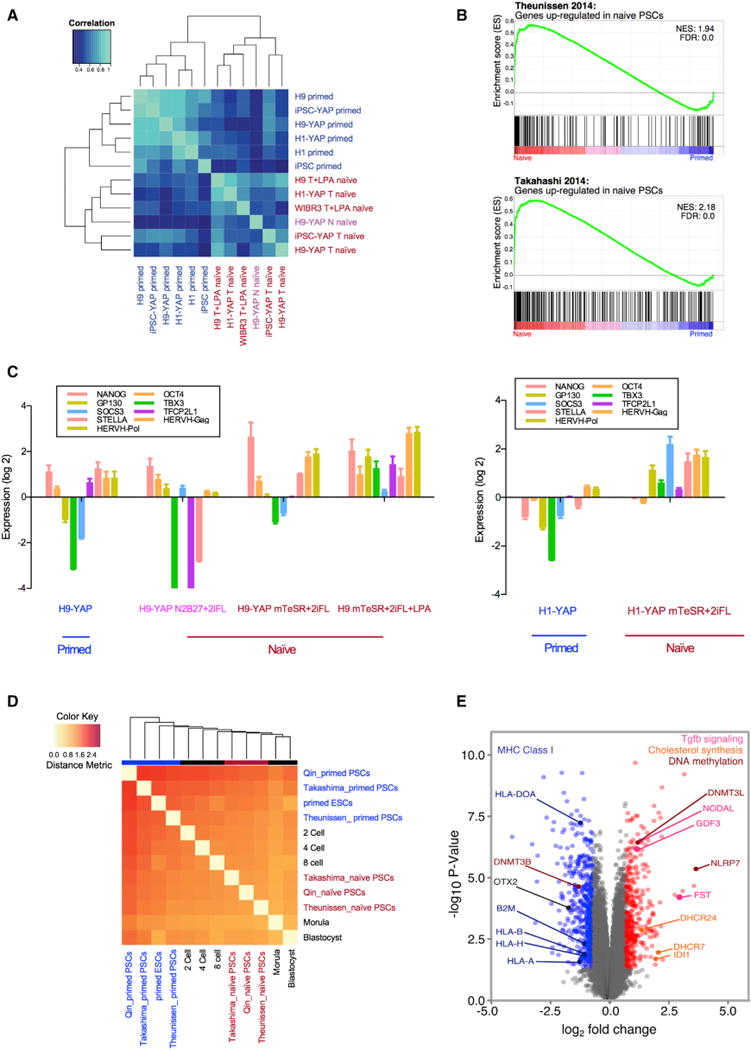
(A) Primed PSCs and Yin- and Lin-PSCs have distinct gene expression profiles, as shown by unsupervised hierarchical clustering. The top 1,000 genes with the highest coefficient of variation were used to cluster samples using Pearson correlation coefficients. Six human primed PSC samples include H9, H1, IMR-90 iPSCs, H9-YAP, H1-YAP, and IMR-90 iPSC-YAP cells. Six human naive PSC samples include H9-YAP in N2B27+2iFL (H9-YAP N naive), H9-YAP in mTeSR+2iFL (H9-YAP T naive), H1-YAP in mTeSR+2iFL (H1-YAP T naive), IMR-90 iPSC-YAP cells in mTeSR+2iFL (iPSC-YAP T naive), H9 in mTeSR+2iFL+LPA (H9 T+LPA naive), and WIBR3 in mTeSR+2iFL+LPA (WIBR3 T+LPA naive). Primed cells are indicated in blue. H9-YAP in N2B27+2iFL naive medium is in pink, and all other naive cells are in red.
(B) GSEA reveals that Yin-PSCs and Lin-PSCs have gene expression profiles concordant with naive PSCs from other studies. The upper panel is the enrichment plot for the gene set of Theunissen et al. (2014) upregulated in naive by Log2 FC > 3.0. The lower panel is the enrichment plot for the gene set of Takahashi et al. (2014) upregulated in naive by Log2 FC > 2.0. Vertical black bars represent the position of genes upregulated in naive cells in the Takashima et al. (2014) or Theunissen et al. (2014) studies, distributed along the differential expression values for the entire transcriptome in this study, and ranked from upregulated in Yin-PSCs and Lin-PSCs (red, left) to upregulated in parental primed PSCs (blue, right).
(C) Yin-PSCs and Lin-PSCs express markers specific for naive pluripotency, as confirmed by qRT-PCR. Values were normalized to GAPDH and UBB and then compared to H9 in primed medium (left panel) or H1 in primed medium (right panel). Data are averages of triplicate PCR reactions, and error bars represent SD.
(D) Hierarchical clustering shows that naive Yin-PSCs and Lin-PSCs are similar to naive cells from two other studies (Takashima et al., 2014; Theunissen et al., 2014) and to human pre-implantation embryos. In vivo states at various developmental stages (Yan et al., 2013) are included in the clustering.
(E) Volcano plot of significantly differentially expressed genes among the six human naive PSC samples and the six human primed PSC samples. Highlighted in red are genes with aLog2 FC > 0.7 in naive and p < 0.05. In blue are genes with a Log2 FC < −0.7 and p < 0.05 in naive. See text for a description of the specific genes indicated.