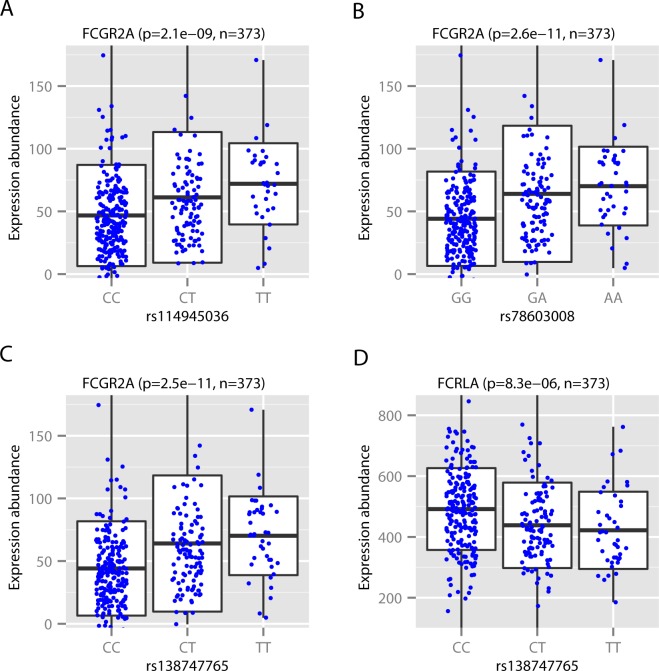
Fig 1. FCGR2C polymorphisms associate with FcγR gene expression in B cells in the European (EUR) population.
A. The boxplot shows the distribution of the expression (y-axis) of the last exon (hg19, chr1: 161487765–161489358) of FCGR2A in B cells from the 373 EUR individuals as quantified in [7], stratified by the genotypes (x-axis) of the SNP rs114945036. Individual expression levels are (horizontal line = median; bottom and top of box = 25th and 75th percentile). Expression in individuals is shown in blue dots. The significance of the association is indicated immediately above, which were mapped in [7] using a linear model implemented in Matrix eQTL [10]. B. Similar as A, for the SNP rs78603008. C. Similar as A, for the SNP rs138747765. D. Similar as A, for the SNP rs138747765 and the expression of the third exon (hg19, chr1:161680550–161680702) of FCRLA (Fc receptor-like A) in B cells.

