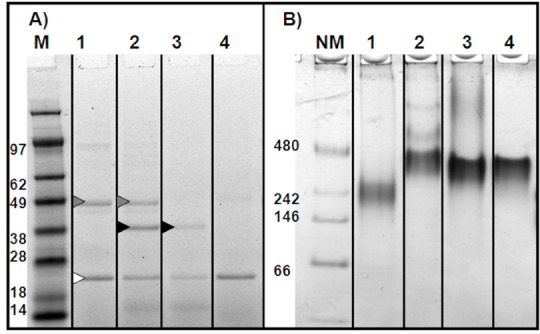
Fig 3. Gel electrophoresis indicates NLP complex formation with YopB and/or YopD.

Purified expressed YopB and/or YopD co-expressed with Δ49ApoA1 in the presence of lipid. A) Denatured 4–12% Bis-Tris PAGE gel, MES-SDS buffer, Native Tris-glycine buffer, detection by SyproRuby fluorescence total protein stain. B) Native 4–12% Tris-glycine PAGE gel, Native Tris-glycine buffer, detection by SyproRuby fluorescence total protein stain. The lanes are represented as follows with the predicted molecular weight based on native gel size; 1) YopB with Δ49ApoA1, 237 kDa complex; 2) YopB/D with Δ49ApoA1, 448 kDa complex; 3) YopD with Δ49ApoA1, 397 kDa complex; 4) Δ49ApoA1 only (empty-NLP), 393 kDa complex; M) Mass standard (kDa) SeeBlue Plus 2 (Invitrogen); NM) Protein mass standard (kDa) NativeMark (Invitrogen). Grey arrow YopB; Black arrow YopD; White arrow Δ49ApoA1.
