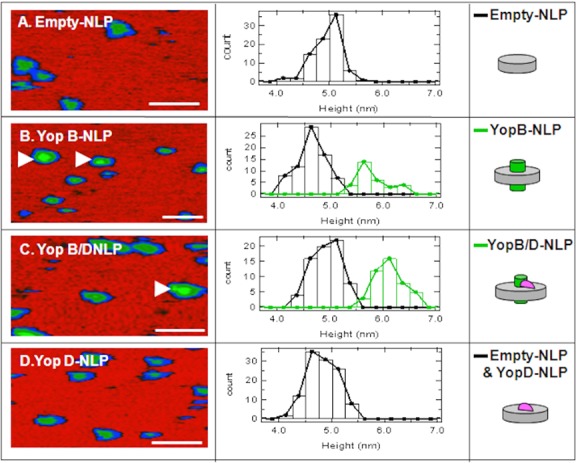
Fig 4. Atomic Force Microscopy (AFM) of empty- and Yop-NLPs.

Left panels, Atomic force microscopy (AFM) image of Empty- and Yop-NLPs prepared by co-expression. 100 nm scale bar. Center panels, AFM height distribution plots. Right panels, NLP cartoons with and without Yop insertion. A) empty-NLPs. B) YopB-NLPs. Black Line: empty-NLPs representing 70% of the total; Green Line: co-expressed YopB-NLPs representing 30% of total. C) YopB/D-NLPs. Black Line: empty-NLPs representing 61% of the total; Green Line: co-expressed YopB-NLPs representing 39% of the total. D) YopD-NLPs. Black Line represents all particles; YopD-NLPs were indistinguishable from empty-NLPs.
