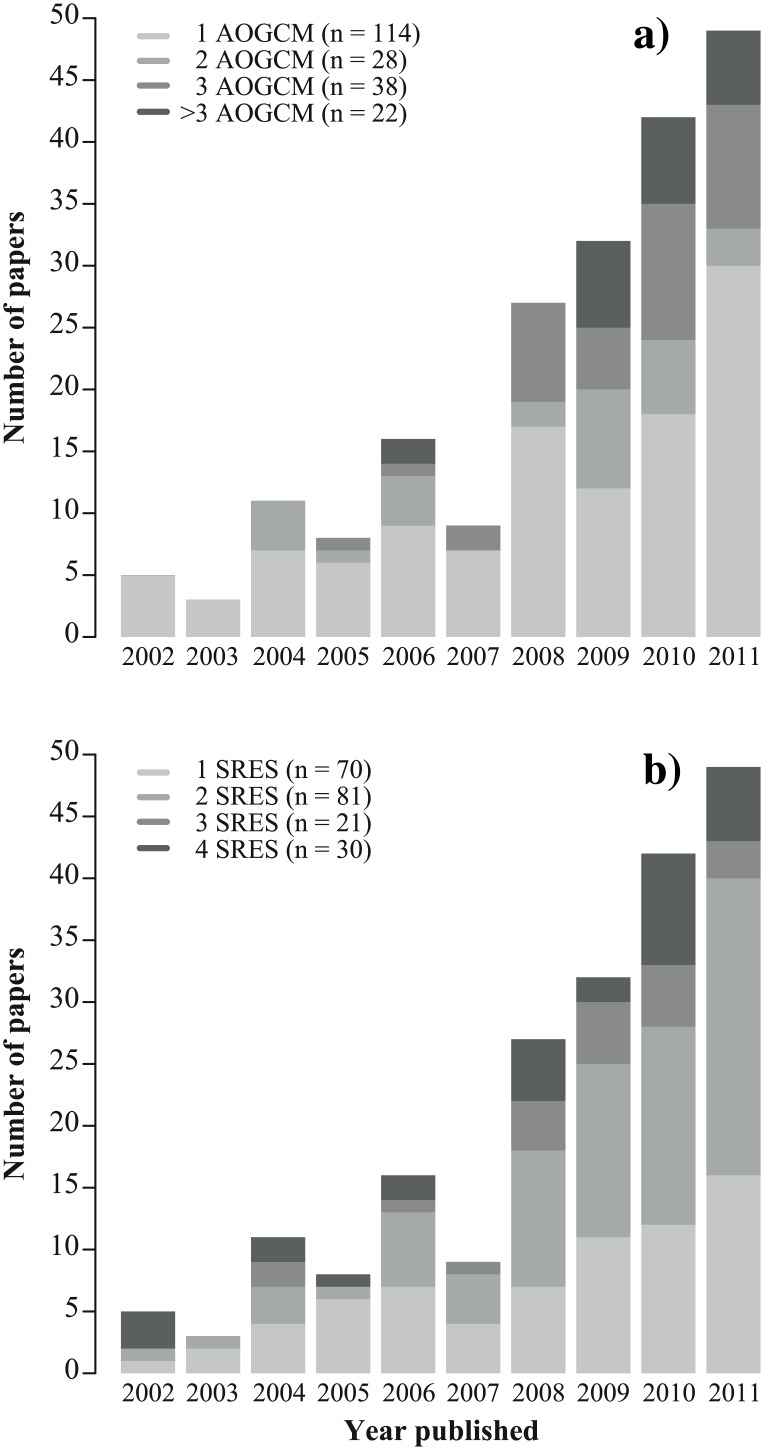
Fig 1. Use of climate models and emissions scenarios in papers reporting species distribution models.
Histograms show the number of publications per year (2002–2011) using 1, 2, 3 or > 3 coupled atmosphere-ocean general circulation models (AOGCMs) (a) and 1, 2, 3 or 4 emissions scenarios from the special report of emissions scenarios (SRES) (b) to project species distribution under climate change. Data come from a literature search in ISI Web of Science performed on June 5, 2013 and using the following search settings: model* AND species distribution OR ecological niche OR habitat suitability OR bioclimatic envelope OR environmental niche OR habitat distribution OR niche-based AND climat* change OR global warm*.

