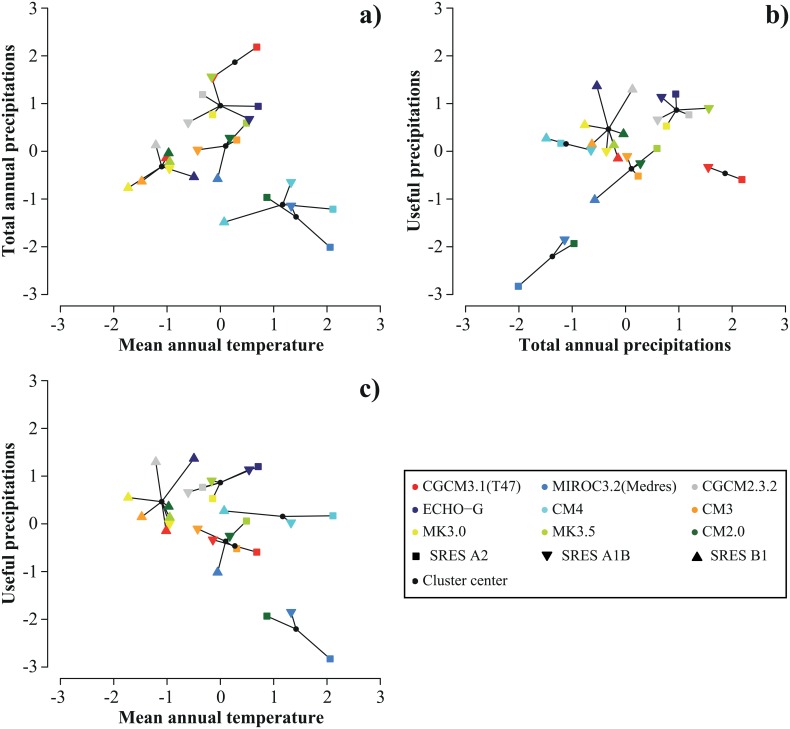
Fig 2. Clustering of climate change scenarios.
Scatter plots show the clustering of climate change scenarios in two dimensions: standardized delta value (Δ) of total annual precipitation as a function of Δ mean annual temperature (a), Δ total annual precipitation as a function of Δ useful precipitation (b), Δ useful precipitation as a function of Δ mean annual temperature (c).

