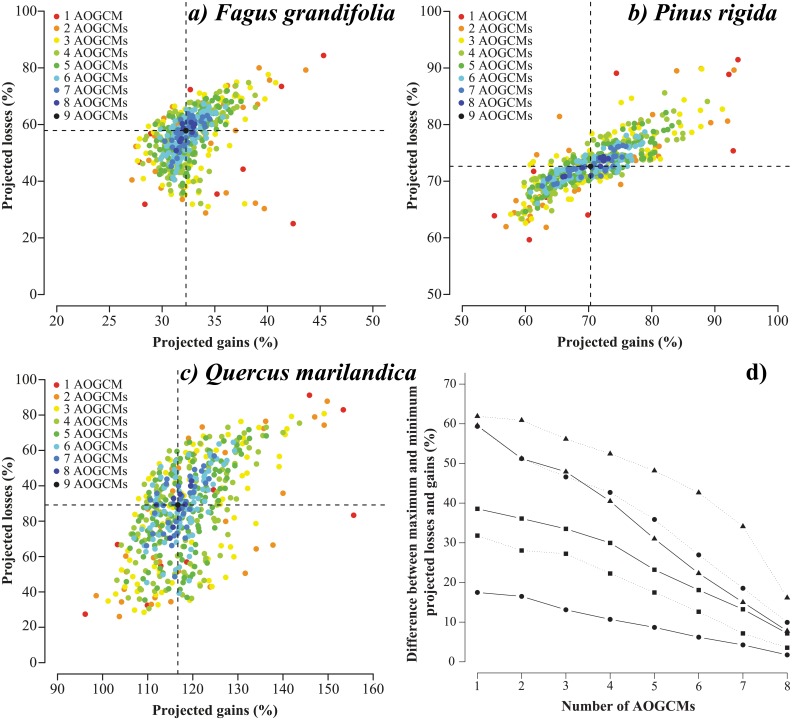
Fig 4. Scatter plots showing uncertainty arising from an arbitrary selection of AOGCMs.
Scatter plots (a), (b), and (c) show the projected habitat losses and gains obtained under each ensemble forecasting realized with one to nine AOGCMs for Fagus grandifolia, Pinus rigida, and Quercus marilandica, respectively (dashed lines show average projected losses and gains). Scatter plot (d) represents differences between maximum and minimum projected losses (dashed lines) and between maximum and minimum projected gains (solid lines) for Fagus grandifolia (circles), Pinus rigida (squares), and Quercus marilandica (triangles) using one to eight AOGCMs.

