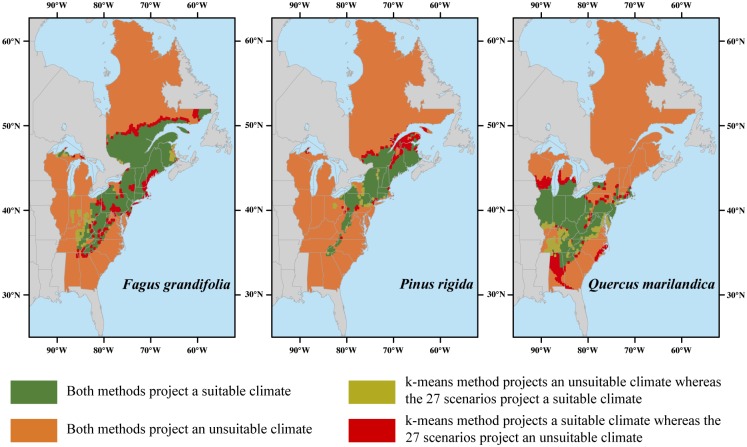
Fig 5. Effects of k-means clustering on potential future species distributions.
Maps show differences between the projected climatic habitat distributions (2071–2100) obtained under an ensemble forecasting with the 27 climate change scenarios and an ensemble forecasting with the six climate change scenarios selected by the k-means algorithm for the three tree species.

