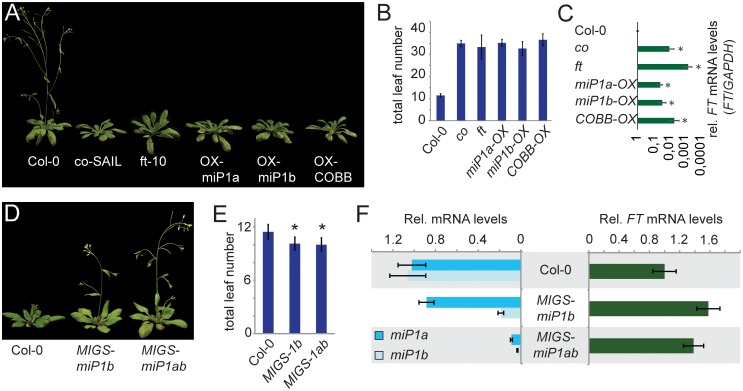
Fig 2. Transgenic plants with elevated microProtein levels are late flowering under inductive long day conditions owing to decreased levels of FT expression.
(A) Image of representative late flowering co, ft, 35S::miP1a, 35S::miP1b and 35S::COBB plants compared to a Col-0 wild type plant of the same age. (B) Quantification of flowering in long day conditions by counting the number of leaves produced at bolting. Error bars represent the standard deviation. (C) Quantification of transcript levels by qRT-PCR shows that FT expression levels in all late flowering plants are severely reduced compared to wild type Col-0 plants. Asterisk p<0.001. (D) Image of representative early flowering 35S::MIGSmiP1b and 35S::MIGSmiP1ab transgenic plants compared to a Col-0 wild type plant of the same age. (E) Quantification of flowering in long day conditions by counting the number of leaves produced at bolting. Error bars represent the standard error. Asterisk p<0.01. (F) Quantification of transcript levels by qRT-PCR shows that miP1b mRNA expression levels are significantly reduced in 35S::MIGS-miP1b transgenic plants while FT mRNA levels are slightly increased. In 35S::MIGS-miP1ab transgenic plants expression levels of both miP1 and miP1b mRNA are strongly reduced compared to Col-0 wild type plants while FT mRNA levels are slightly increased.

