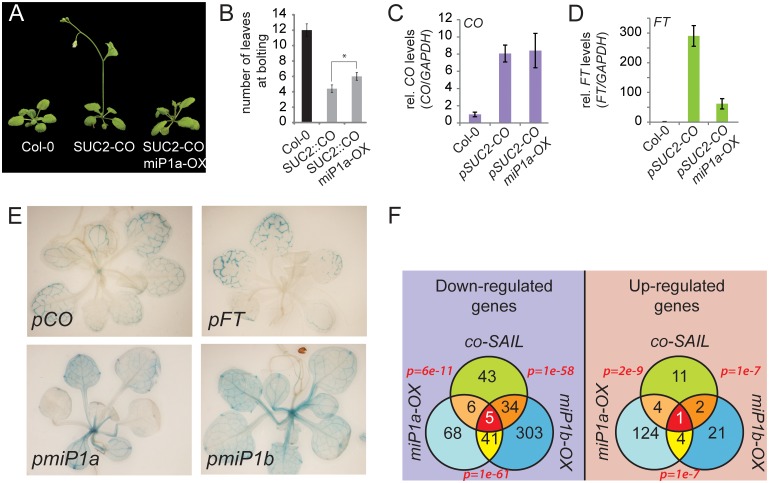
Fig 4. Genetic interaction studies reveal that miP1a/b control CO protein activity, have the same spatial expression pattern and are feedback-regulated via the photoperiodic flowering time pathway.
(A) Image of representative Col-0 wild type, SUC2::CO and SUC2::CO 35S::miP1a plants of the same age. (B) Quantification of flowering in long day conditions by counting the number of leaves produced at bolting. Asterisk p<0.001. (c, d) Quantification of transcript levels of (C) CO and (D) FT by qRT-PCR shows that CO expression levels are up-regulated in both SUC2::CO and SUC2::CO 35S-miP1a plants but FT levels are higher in SUC2::CO compared to SUC2::CO 35S-miP1a. (E) Spatial expression pattern of CO, FT and miP1a and miP1b reveals that all genes are expressed in vascular tissue of vegetative rosette leaves. (F) Comparison of the transcriptomes of co-SAIL, 35S::FLAG-miP1a and 35S::FLAG-miP1b relative to Col-0 wild type plants. Venn diagrams showing overlap between up- and down-regulated genes; p-values are based on the hypergeometric distribution function (phyper using R 3.2.2).

