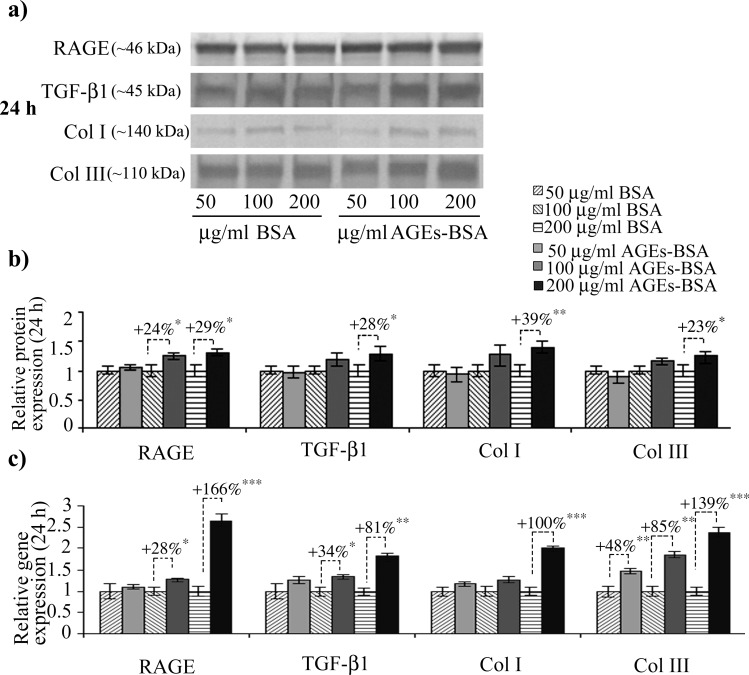
Fig 2. Increased RAGE, latent TGF-β1, collagen I and III gene and protein expression in CCD-1070Sk fibroblasts after 24 h of AGE-BSA exposure.
Representative immunoblots (a) and the corresponding densitometry analysis. Each immunoreactive band was normalized to the total proteins transferred in the corresponding lane. Data are relative to controls (BSA treated cells) and represent means ± SD (b). Relative gene expression for RAGE, TGF-β1, Col I and III levels is shown in (c). p values indicate statistically significant changes * for p< 0.05; ** for p< 0.01; *** for p< 0.001.

