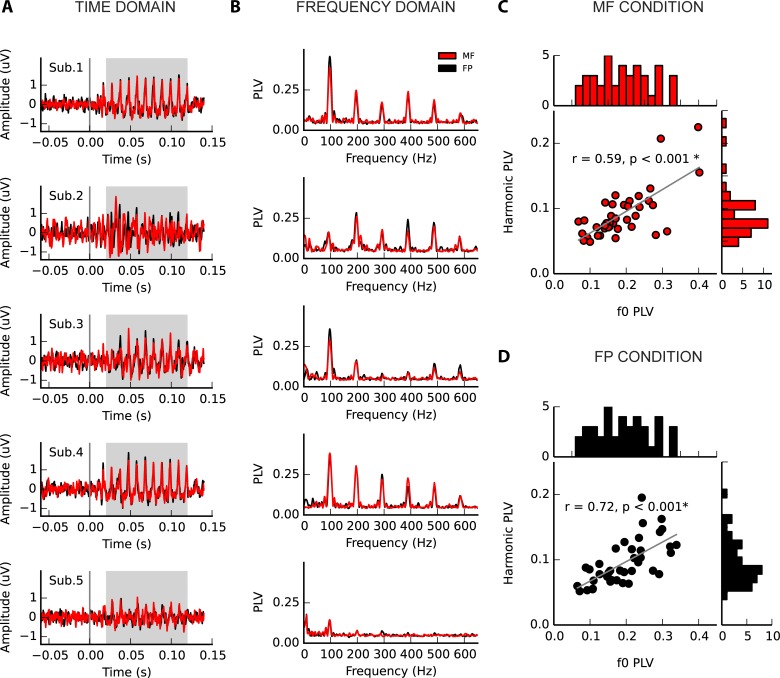
Fig 3. Inter-individual variability in frequency following response to complex tones that contain (black), or lack (red) energy at the fundamental frequency (f0).
(A) Time domain representation of five example subjects (band-pass filtered between 80 and 2000Hz), demonstrating variation in ABR waveform. Grey shading indicates the FFR portion of the signal. (B) Frequency domain representation of the example subjects’ FFR. Variability is evident in the strength of the encoding of the f0 (98Hz) and its harmonics (integer multiples), and in their pattern of relative strength. The relationship between the f0 and mean harmonic PLVs (2nd-5th harmonics), in the (C) missing fundamental and (D) fundamental present conditions demonstrates considerable variability in the strength of each and their relationship, although in general people with a strong representation of the f0 have a strong representation of the harmonics. Histograms are associated with each axis to illustrate the distributions (above: f0 PLVs; right: mean harmonic PLVs).

