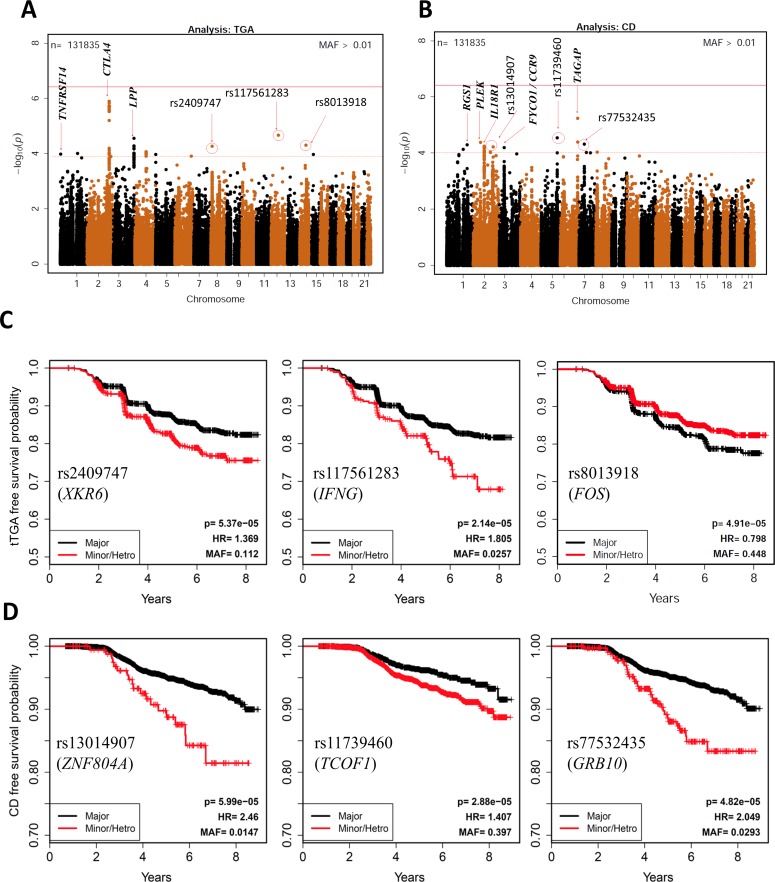
Fig 2. Associations with risk of celiac disease and risk of persistent tissue transglutaminase autoantibody (tTGA) positivity.
Manhattan plot of 133,620 SNPs with MAF>0.01, displaying the P-values on the −log10 scale for SNP associations with celiac disease (A) and persistent tTGA positivity (B). HRs and p-values are calculated using three possible genotypes and adjusted for family history of celiac disease, HLA-DR-DQ genotype, gender, HLA-DPB1, population stratification (ancestral heterogeneity) and country of residence (as strata). The red dashed line represents p = 1x10⁻⁴, the red solid line represents Bonferroni correction threshold. Kaplan-Meier plots of selected SNPs associated with celiac disease (C) and persistent tTGA (D) are plotted by dividing the subjects in two groups: (i) Major homozygous (black curves) and (ii) Heterozygous combined with minor homozygous (red curves).

