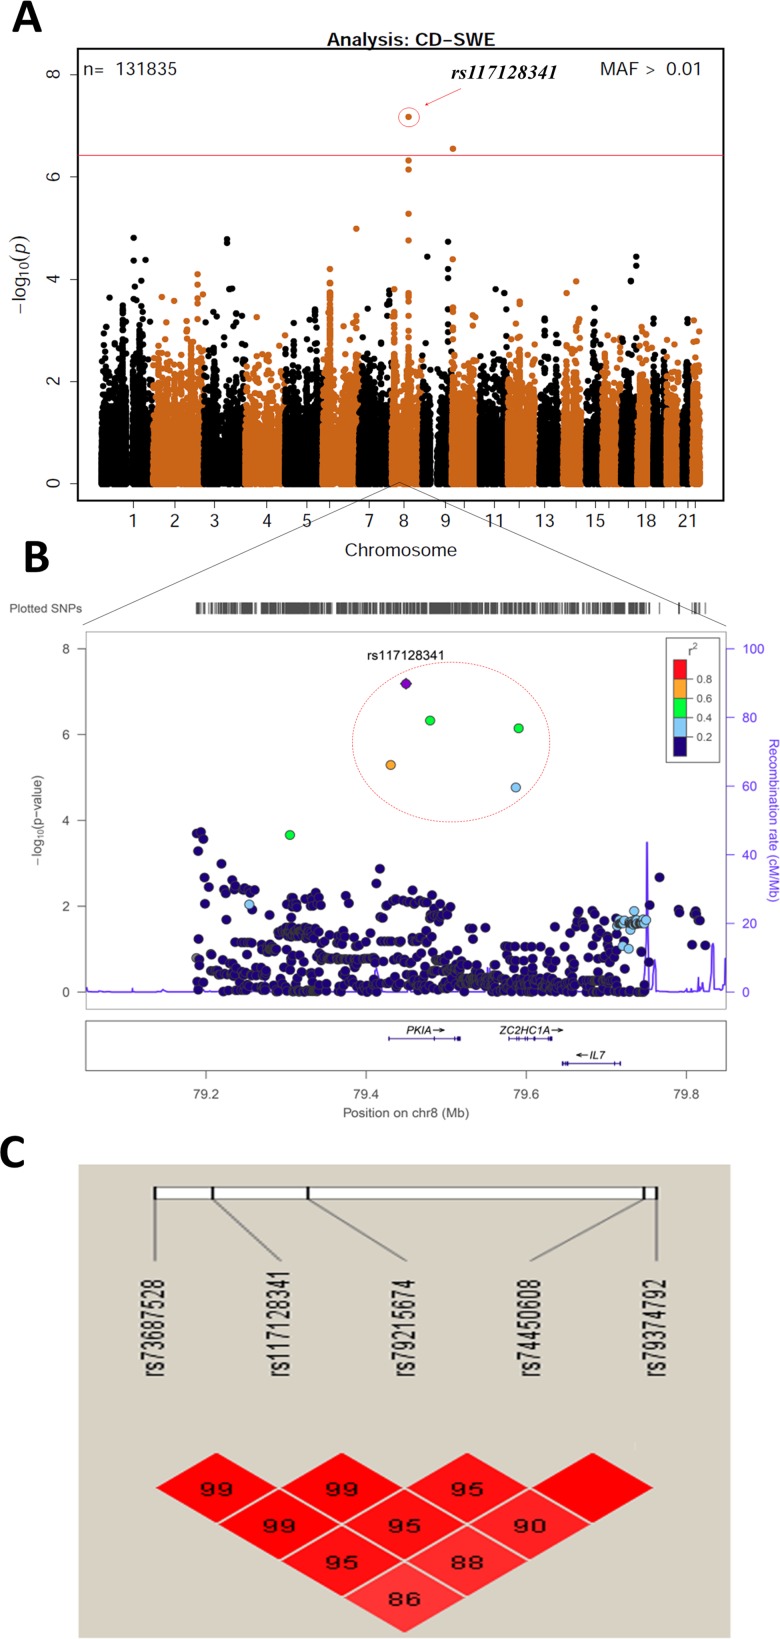
Fig 3. Associations with risk of celiac disease in the Swedish population.
A: Manhattan plot of 133620 SNPs with MAF>0.01, displaying the P-values on the −log10 scale for the SNPs associated with celiac disease in the Swedish TEDDY population. B: Regional association plots at the PKIA locus generated by LocusZoom, showing the significance of association and the recombination rate. Colors represent HapMap CEU linkage disequilibrium r2 values with the most significantly associated SNP (rs117128341; shown in purple). C: Pairwise LD plot for five SNPs in the region of PKIA. The five most significant SNPs from this region are in high LD with each other.

