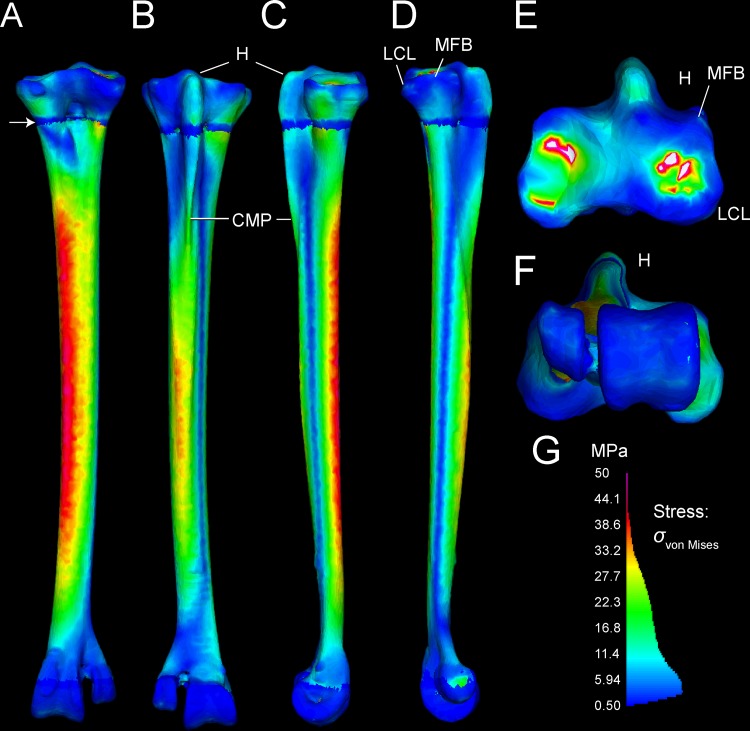
Fig 11. σvon Mises stresses in the ostrich tarsometatarsus represents the maximum strain energy distorting a given element, and indicates proximity to breaking.
A (anterior), B (posterior), C (medial), and D (lateral) views reveal the highest stresses in the shaft concentrated anteromedially. A white arrow (A) indicates the proximal transition between cancellous and compact material properties. Muscle induced stresses are evident on the hypotarsus (small H), continuing onto the Crista plantares medialis (CPM); however, these are low compared to stress in the main tarsometatarsus shaft. E. and F. show clipped stresses (white as with clipped highlights in photography; greater than the maximum in the color scale) at the proximal constraints, and low stresses distally. G. The σvon Mises color scale from 0–50 MPa runs from low (blue) to high (red and pink). As in Fig 10, the scale also depicts a histogram of the proportion of elements experiencing different stress magnitudes. The majority of elements have low σvon Mises magnitudes between 0 and 20 MPa.

