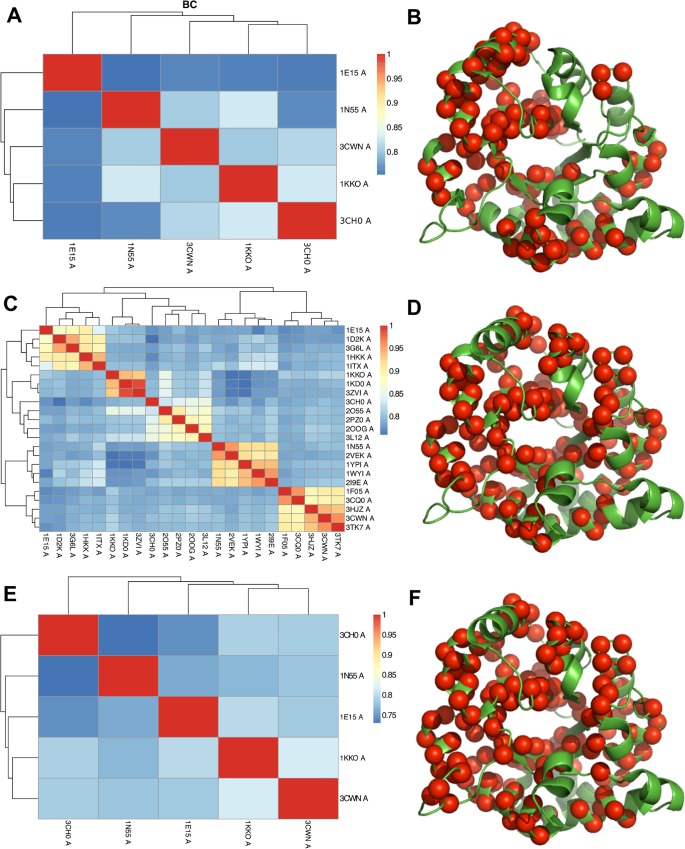
Fig 2. Bhattacharyya coefficient (BC) scores and conserved amino acid positions in the structural alignments.
Heatmap representations of the pairwise BC scores for the structural alignments performed on (A) the five representative TIM barrel fold structures, (C) the 23 homologues and (E) the main five structures as extracted from the alignment of 23 homologues. These alignments correspond to (B) 106, (D) 135 and (F) 145 Cα atom positions conserved (red spheres), respectively. Structures are labelled by their PDB identifiers and represented with green cartoons highlighting their secondary structure elements. The colour scale on the BC maps goes from blue to yellow to red, for low (~0.75) to high (1.0) BC scores. The dendrogram reflects the hierarchical clustering based on the BC scores.

