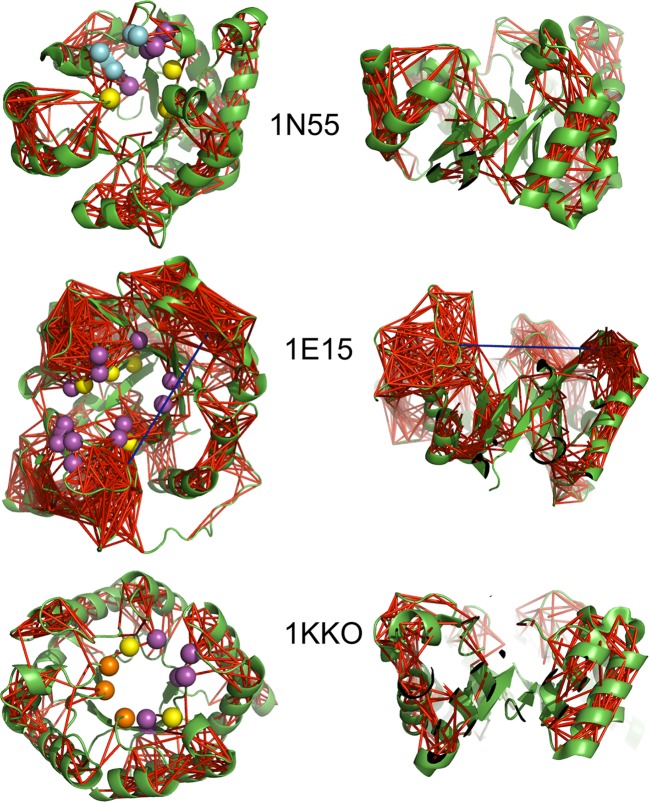
Fig 6. Distribution of distant significant correlations in 1N55, 1E15 and 1KKO.
Top views (left) from the perspective of the C-terminal end and side views (right) with the N-terminal end at the bottom and the C-terminal end at the top. Structures are displayed with the cartoon representation in green. Sticks are drawn between each pair of residue positions that are at least 8 Å apart and have significant correlations (cf. Methods). The sticks in red indicate positive correlations above the score threshold at the 95th percentile rank of the absolute values of the correlations and in blue indicate negative values of correlations below the negative of the score threshold. The yellow spheres represent the positions of the catalytic amino acids while the purple, cyan and orange spheres represent substrate, phosphate and metal-ion binding residues, respectively.

