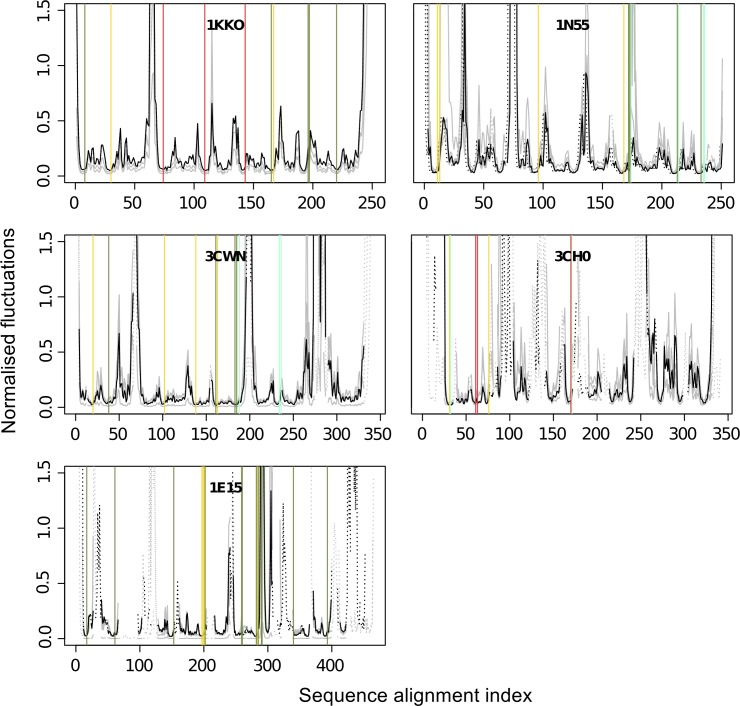
Fig 7. Normalised fluctuations with annotated functional sites.
The catalytic residue sites annotated as yellow solid lines, with the substrate binding sites as green, phosphate-binding sites as cyan and the metal ion binding sites as red. The black solid lines represent the main TBF protein for that superfamily, while the grey lines are the homologues. The dotted lines represent the gaps in the alignment.

