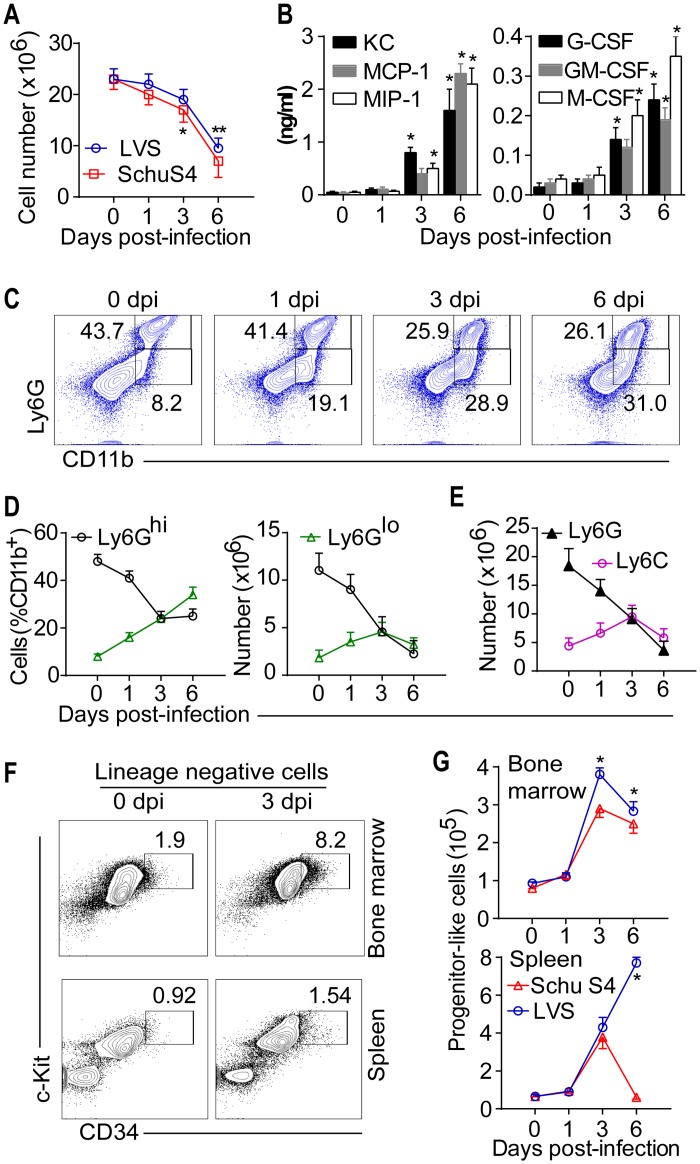
Fig 3. Medullary and extra-medullary myelopoiesis during lethal Ft infection.
(A) Total number of BM cells in Ft infection (mean ± SD of two (SchuS4, n = 6 mice) or three (LVS, n = 9 mice) independent experiments, Student’s t-test, *p<0.05, **p<0.01). (B) Cytokine levels in BM aspirates of Ft LVS-infected mice (mean ± SD of two independent experiments, n = 6 mice, ANOVA test with Tukey’s post-test, *p<0.05). (C) Representative flow plots of bone marrow (BM) cells for analysis of myelopoiesis in Ft LVS infection. (D) Frequency/total numbers of Ly6Ghi and Ly6Glo cells in BM and (E) total numbers of Ly6G+ and Ly6C+ cells in BM (mean± SD of three independent experiments, n = 9 mice, Student’s t-test, *p<0.05). (F) Representative flow plots for analysis of progenitor-like cells and (G) their numbers in BM and spleen during Ft infection (mean ± SD of two (SchuS4, n = 6 mice) or three (LVS, n = 9 mice) independent experiments, Student’s t-test, *p<0.05).

