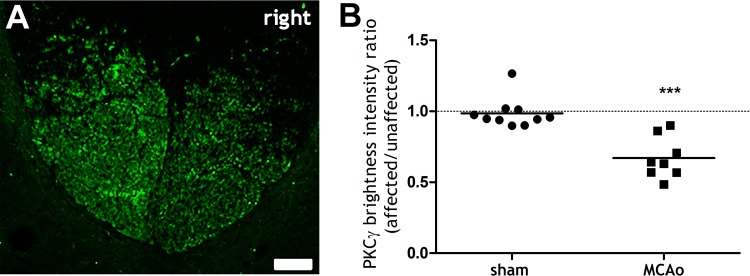
Fig 5. Axonal loss in the dorsal columns at 28 days following MCAO.
A: Projected confocal microscope image of the dorsal columns (C8) from a rat with MCAO immunolabelled for PKC-γ. Note the reduced PKC-γ immunoreactivity in the affected (right) side, indicative of CST axonal loss (Scale bar = 50μm). B: PKC-γ brightness intensity, expressed as a ratio of affected (right) side/unaffected (left) side, was significantly reduced in the MCAO group compared to the sham group. Each data point represents a spinal section (2 per rat). The dashed horizontal line indicates 1, which denotes symmetrical PKC-γ immunoreactivity between affected and unaffected sides. ***p<0.0001, Mann-Whitney test MCAO compared to sham.

