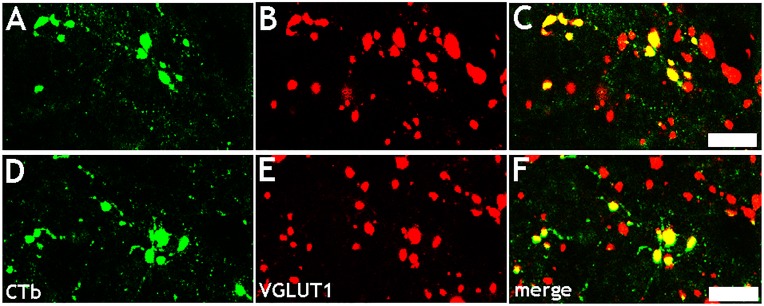
Fig 7. Co-localisation of VGLUT1 with CTb-labelled axonal swellings.
Confocal microscope images showing co-expression of VGLUT1 with CTb-labelled axonal swellings in the spinal cord originating from the non-ischaemic hemisphere. A: Single optical section showing CTb-labelled axonal swellings (green) in a sham rat. B: immunoreactivity in the same plane for VGLUT1 (red). C: Merged image. D-F: A similar series is also shown for a MCAO rat. Scale bars = 5μm.

