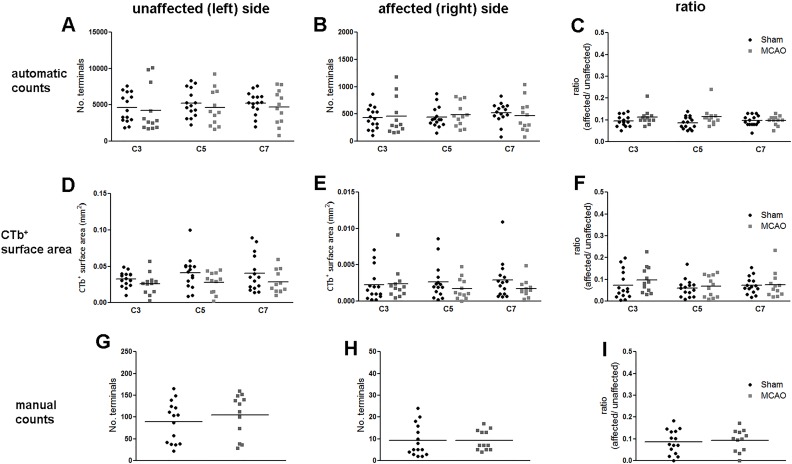
Fig 9. Quantification of CTb-immunoreactivity the cervical spinal cord.
For each of the three quantification methods, results are presented for the unaffected (left) side, affected (right) side and the ratio (affected/unaffected). A,B,C: Automatically counted terminals. D,E,F: CTb+ surface area. G,H,I: manually counted terminals. There were no significant differences between sham and MCAO rats (p>0.05). Data represent mean ± SD. Each point represents counts from a single spinal section (3 per rat).

