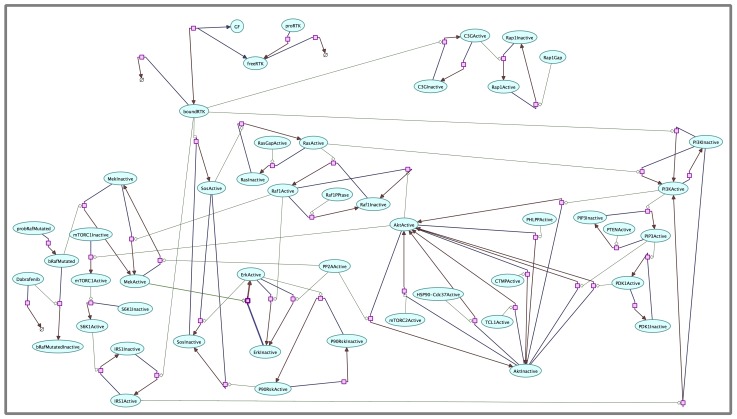
Fig 1. Diagram of PI3K-AKT and MAPK signaling pathways implemented into the model.
Activation/deactivation reactions (modeled with a modified Henri-Michaelis-Menten law) are shown in the following way: the modifier i.e., the catalyst that triggers the reaction is depicted by a thin light green line ending with a rhombus; the involved species are connected by arrows starting with a blue color (input species) and ending with a brown color (resulting species). For example, Raf1Inactive becomes activated (Raf1Active) through RasActive. Reactions that physiologically inactivate species (modeled with mass action law) are depicted by an arrow starting with a blue color and ending with a brown color, for example C3G deactivation. Proteins degradation (modeled with mass action law) are depicted with the considered species connected by an arrow ending with an empty set symbol, for example Dabrafenib degradation. Proteins production (modeled with irreversible constant flux law) are depicted with the considered species connected by an arrow (for example, the production of free RTK). The Arcadia software (http://arcadiapathways.sourceforge.net) has been used to produce the graphical representation of the model.

