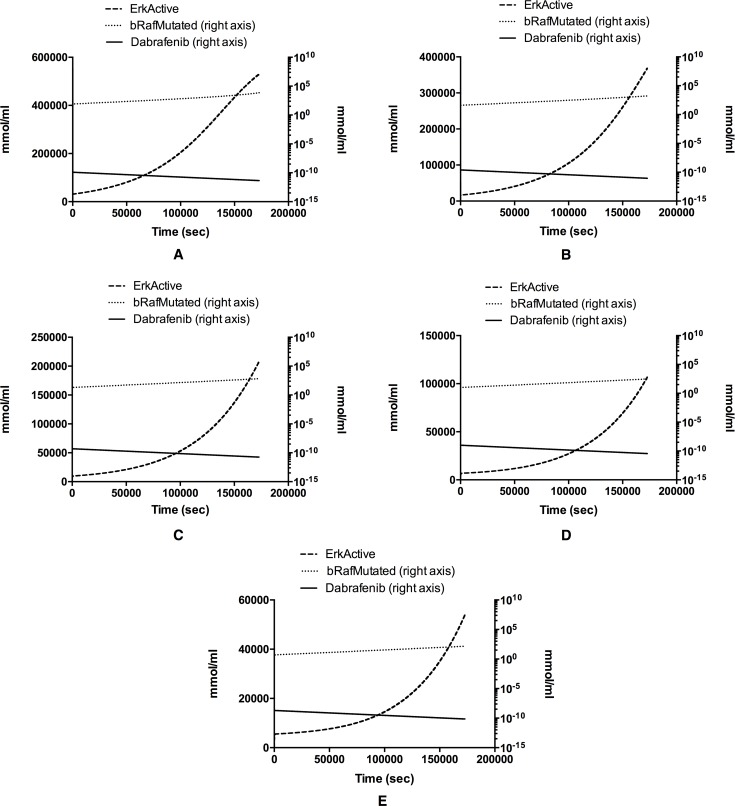
Fig 4. pERK, B-RAF and Dabrafenib in silico dynamics.
pERK concentrations decrease during Dabrafenib treatment in A375 melanoma cell line. The behavior of pERK is directly correlated to the Dabrafenib concentration. Different dosages of Dabrafenib are shown (1nM = 1e-9 mmol/ml): 1.25e-10 mmol/ml (A), 2.5e-10 mmol/ml (B), 5e-10 mmol/ml (C), 1e-9 mmol/ml (D) and 2e-9 mmol/ml (E). In all the panels the right y-axis dotted lines represent bRafMutated concentrations while solid lines represent Dabrafenib concentrations.

