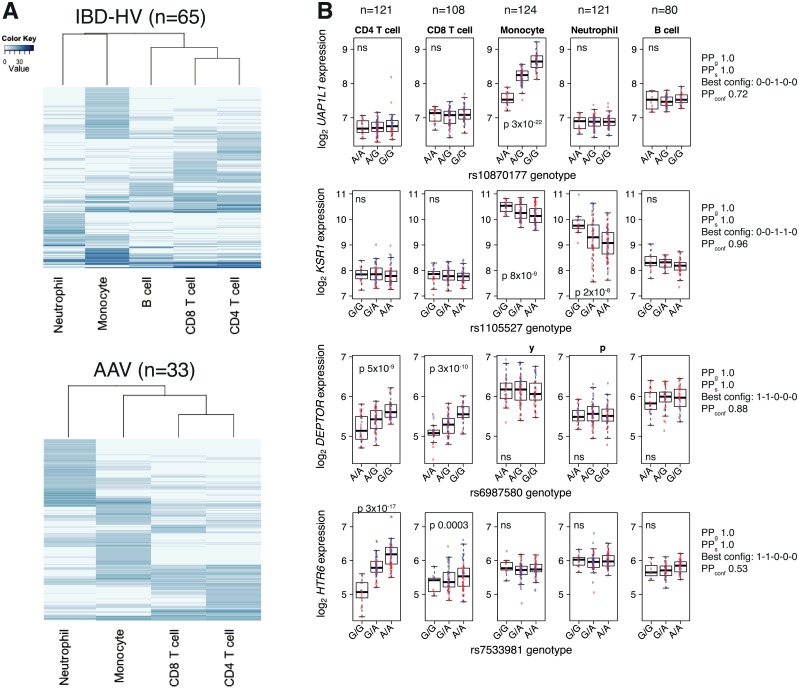
Fig 2. eQTL sharing is related to haematopoietic lineage.
(A) Heatmap representation of the matrix of association statistics (chi-squared scores) from one-at-a-time cell-type cis eQTL scans using PEER-adjusted expression data. Rows are SNP-gene pairs, columns are cell types, and the association statistic (chi-squared score) is represented by the shading in the colour key. The stronger the association the darker the blue shading. Rows and columns have both been hierarchically clustered. Analysis has been limited to the set of individuals with complete expression data across cell types to ensure equal statistical power (5 and 4 cell types in the IBD-HV and AAV analyses respectively). (B) Examples of cell- and lineage-specific eQTLs. From top: monocyte-specific, myeloid-specific, and two T lymphocyte-specific eQTLs. For ease of biological interpretation, here we show RMA-normalised expression values before adjustment for batch, sex and latent factors with PEER. Boxplots indicate median, and upper and lower quartiles. For PEER-adjusted values, see S4 Fig. Blue and red dots represent HV and IBD respectively. P-values are from association using PEER-adjusted data. ns = not significant. PPg = posterior probability that the gene has at least one eQTL in at least one cell type (joint cell type analysis with eQTLBMA). PPs = posterior probability that the SNP is an eQTL for the gene in at least one cell type, given that the gene has an eQTL. ‘Best config’ = best configuration of eQTL presence (1) / absence (0) across the 5 cell types. PPconf = posterior probability for the best configuration.

