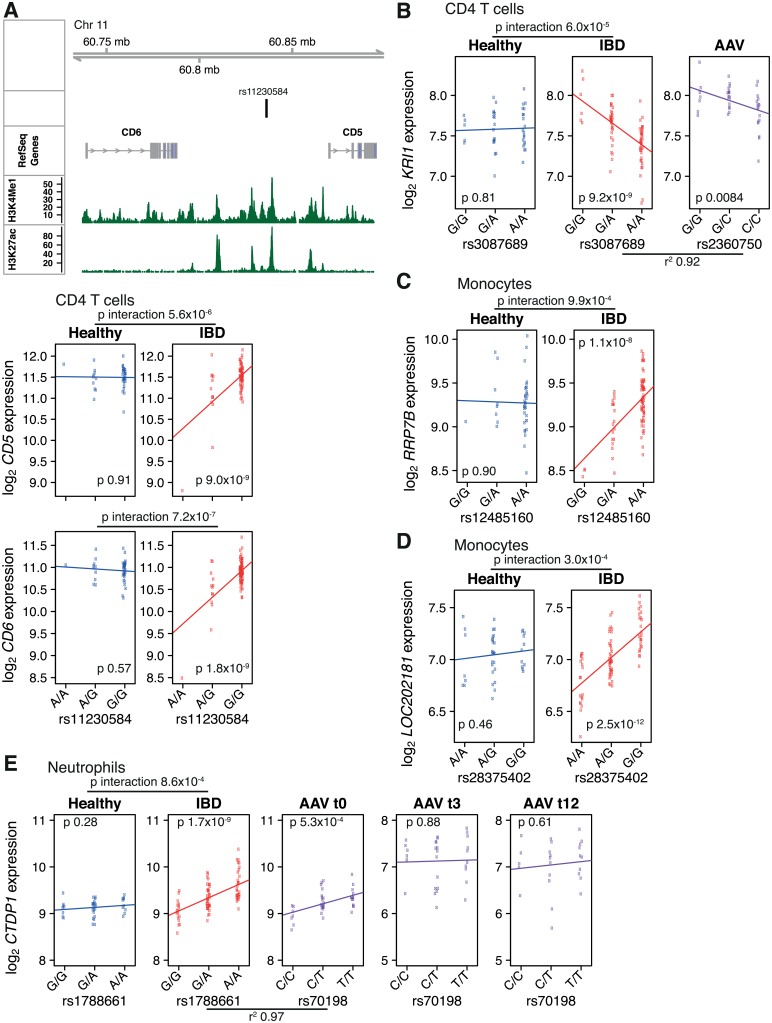
Fig 4. Distinct eQTLs in active inflammatory disease.
Analysis using expression data batch-corrected with ComBat. (A) An eQTL for CD5 and CD6 is present in CD4 T cells from patients with active IBD but not in HVs. Upper panel: genomic features around the eQTL SNP including nearby genes and histone marks from ENCODE lymphoblastoid cell line (hg19 build). Lower panels: expression versus genotype boxplots. The lines indicate the estimated best fit line from the regression of expression on genotype within each cohort. The p-value for the test of the null hypothesis that the coefficient for the genotype term equals zero is shown on the plot. The p-value for genotype × disease interaction term is shown above. (B-D) Further examples of inflammatory disease-dependent eQTLs. Where a proxy SNP was present on the Affymetrix SNP 6.0 array, the AAV expression data is also shown. (E) Inflammation-specific eQTL. t0 = 0 months, t3 = 3 months, t12 = 12 months.

