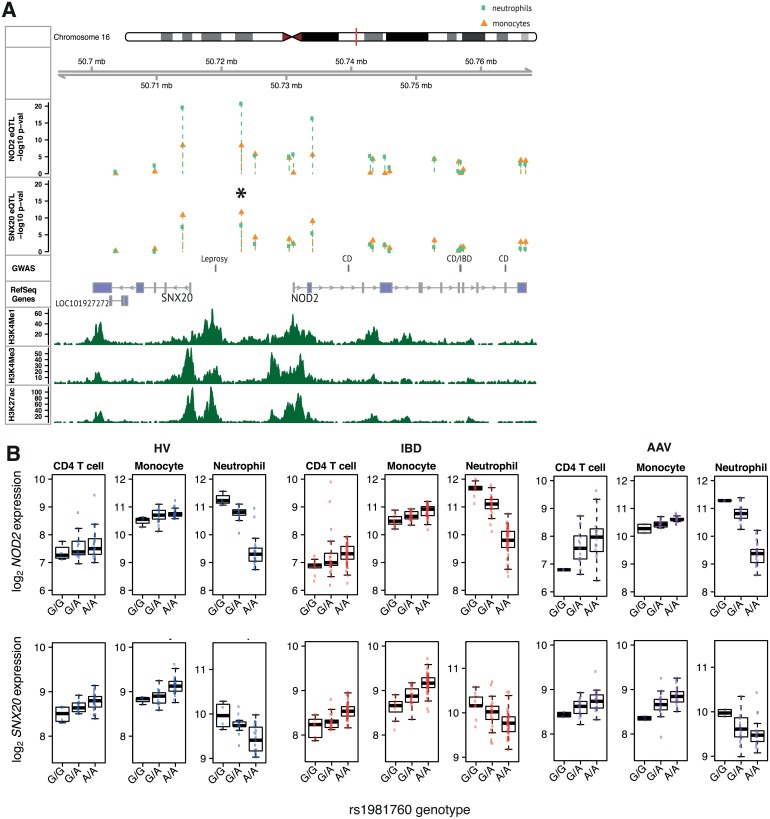
Fig 8. Multiple cell-type eQTL analysis and the genetic aetiology of autoimmune and infectious diseases.
An eQTL for both NOD2 and SNX20, with opposing directions of effect in neutrophils versus CD4 T cells and monocytes, at a leprosy-associated locus (r2 0.922 between eSNP rs1981760 (*) and leprosy-associated SNP rs9302752). (A) Genomic features in the SNX20-NOD2 region. Tracks from top: 1) Chromosome ideogram. Red line indicates the position of the region. 2) Chromosomal position. 3–4) Manhattan plots of association signals for NOD2 and SNX20 expression in monocytes and neutrophils (IBD-HV analysis). 5) Disease associated SNPs from the NHGRI GWAS catalogue. 6) RefSeq genes. 7–9) Histone marks from ENCODE. (B) Expression versus genotype boxplots.

