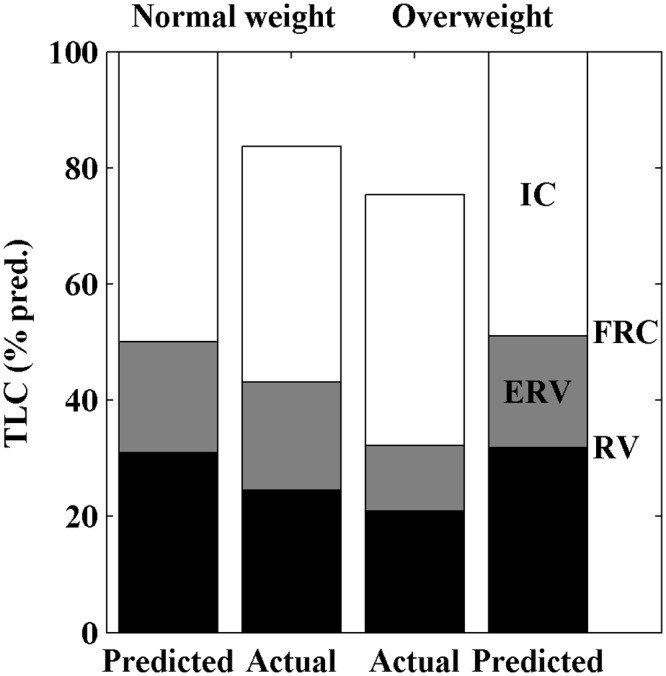
Fig 2. Stacked-bar histogram of total lung capacity (TLC) (% of predicted) in patients with normal weight (body mass index [BMI] < 25 kg/m2, n = 43) and overweight (BMI ≥ 25 kg/m2, n = 62), compared with their predicted values.

The black section of the stacked-bar indicates the residual volume (RV), the gray section the expiratory reserve volume (ERV) and the white section the inspiratory capacity (IC). The RV and ERV combined (black plus grey) is the functional reserve capacity (FRC). A restrictive pattern of pulmonary function is shown for both groups, and the TLC is further decreased in overweight compared with normal-weight patients, mainly due to the decreased ERV.
