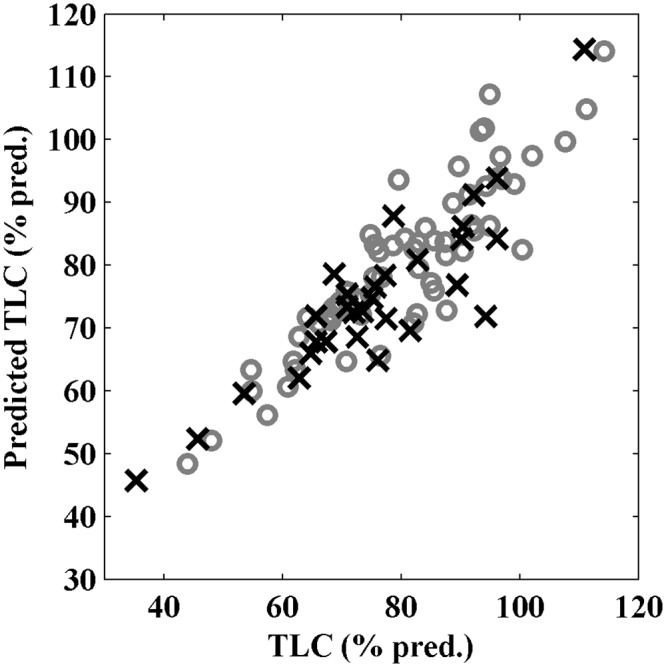
Fig 3. Multiple linear regression model for predicting total lung capacity (TLC) with the significant contributors forced inspiratory volume in 1 second (FIV1) and body mass index (BMI).

Patients in the model and validation set are represented by gray circles and black crosses, respectively. The x-axis denotes the TLC expressed as percentage of the predicted value for each individual and the y-axis denotes the calculated predicted TLC (% pred.), based on FIV1 and BMI.
