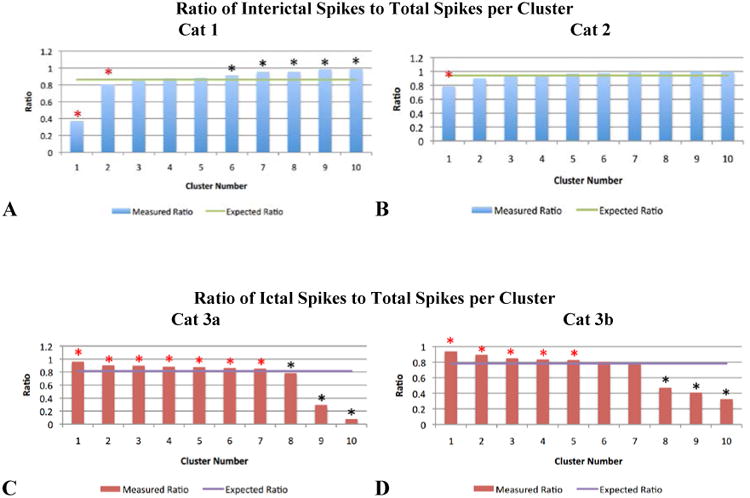
Figure 11.

Ratios of interictal or ictal spikes to total spikes, by cluster. In 11a and 11b (the Cat 1 and 2 data sets), the majority of spikes detected occurred interictally (86.3% and 94.1% respectively, represented by the green horizontal lines). The blue bars depict the observed ratio of interictal spikes to total spikes within a given cluster. In 11c and 11d (the Cat 3a and 3b data sets), the majority of spikes detected occurred ictally (81.4% and 78.1% respectively, represented by the purple horizontal lines). The red bars depict the observed ratio of ictal spikes to total spikes within a given cluster. In all bar graphs, a red asterisk identifies the clusters that showed a statistically significant (p<0.007) preference for containing LFP spikes that occurred during seizure (ictal epochs); a black asterisk identifies the clusters that showed a statistically significant (p<0.001) preference for containing LFP spikes that occurred between seizures (interictal epochs).
