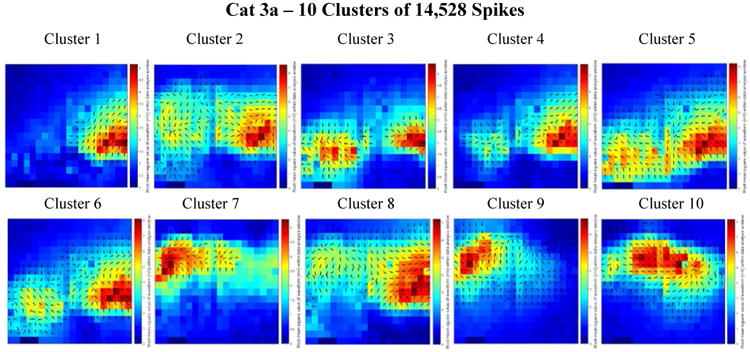
Figure 7.

Combined delay and power maps of the spike closest to each of the ten cluster centers in the Cat 3a data set. These maps were obtained following the implementation of k-medians clustering (k=10) of the spike feature set (one delay and one power feature for each of the 360 channels) to group spikes with similar features into separate clusters. Prior to clustering we employed Principal Component Analysis (PCA) to reduce the dimensionality of this feature set and retained only the number of dimensions necessary to account for 99% of the variance within the data. 281 dimensions were retained in the Cat 3a data set. The colors represent the relative amount of power recorded from each electrode within the 50 ms spike detection window. Blue is relatively low power; red is relatively high power. The black arrows on each plot depict the direction of spike wave propagation (the arrows are not scaled by speed). The speed of wave propagation varied between spikes with the wave from Cluster 8 traveling the fastest, crossing 75% of the width of the array in 16 ms and the wave from Cluster 3 traveling the slowest, crossing 50% of the width of the array in 29 ms. Every cluster is comprised of a mix of ictal and interictal spikes; the percentages of ictal labels varied between clusters.
