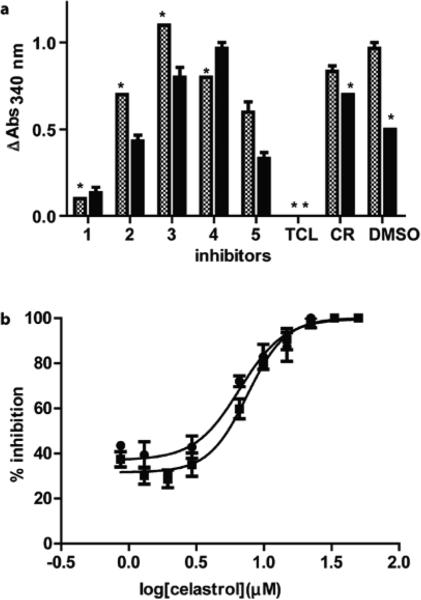
Figure 4.
a) In vitro assay results using 25 μM of each candidate inhibitor, with (checkered box) and without (solid box) NAD+ preincubation. Triclosan (TCL) and cerulenin (CR) served as the positive and negative controls, respectively. b) The average IC50 values of compound 1 were calculated to be 5.9 and 4.7 μM with (●) and without (■) NAD+ preincubation, respectively. Data was collected in triplicate and the individual values were within 10% error. (*) Indicates minimal change error bars.

