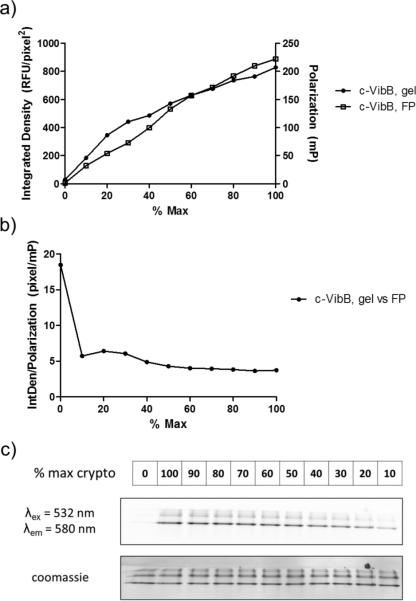
Figure 5. Crypto-VibB monitoring by polarization vs. gel densitometry.
One particular strength of the fluorescence polarization assay lies in the ability to evaluate fluorescence polarization samples by gel electrophoresis if an EDTA quench is used to halt the reaction prior to analysis. Signal obtained from the same crypto-VibB (c-VibB) linear dilution scales with the percentage of labeling (a), as well as providing an almost static correlation above 10% labeling (b). Reference fluorescent gel imaging depicts the fluorescent intensity change with percent labeling (c).

