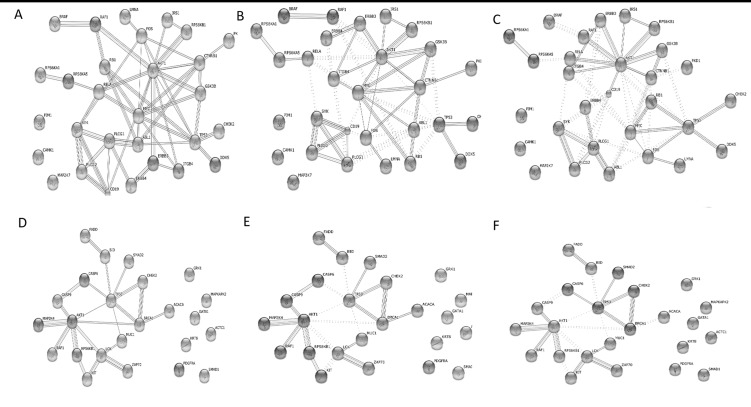
Fig 4. Protein-protein interaction network and signaling pathway analysis.
(A) A PPI network, as shown in the interactive view, generated by a STRING database to reveal functional interactions between up-regulated proteins. Each node represents a protein, and each edge represents an interaction (P-values = 6.06E-12); (B) Up-regulated proteins’ MCL cluster algorithms derived using STRING. MCL = 2; (C) Up-regulated proteins’ K-Means cluster algorithms. K-Means = 4; approximate same consequences by two clusters; (D) A PPI network reveals functional interactions between down-regulated proteins (P-value = 1.47E-6); (E) Down-regulated proteins’MCL cluster algorithms. MCL = 2; (F) Down-regulated proteins’ K-Means cluster algorithms. K-Means = 4.

